Volume
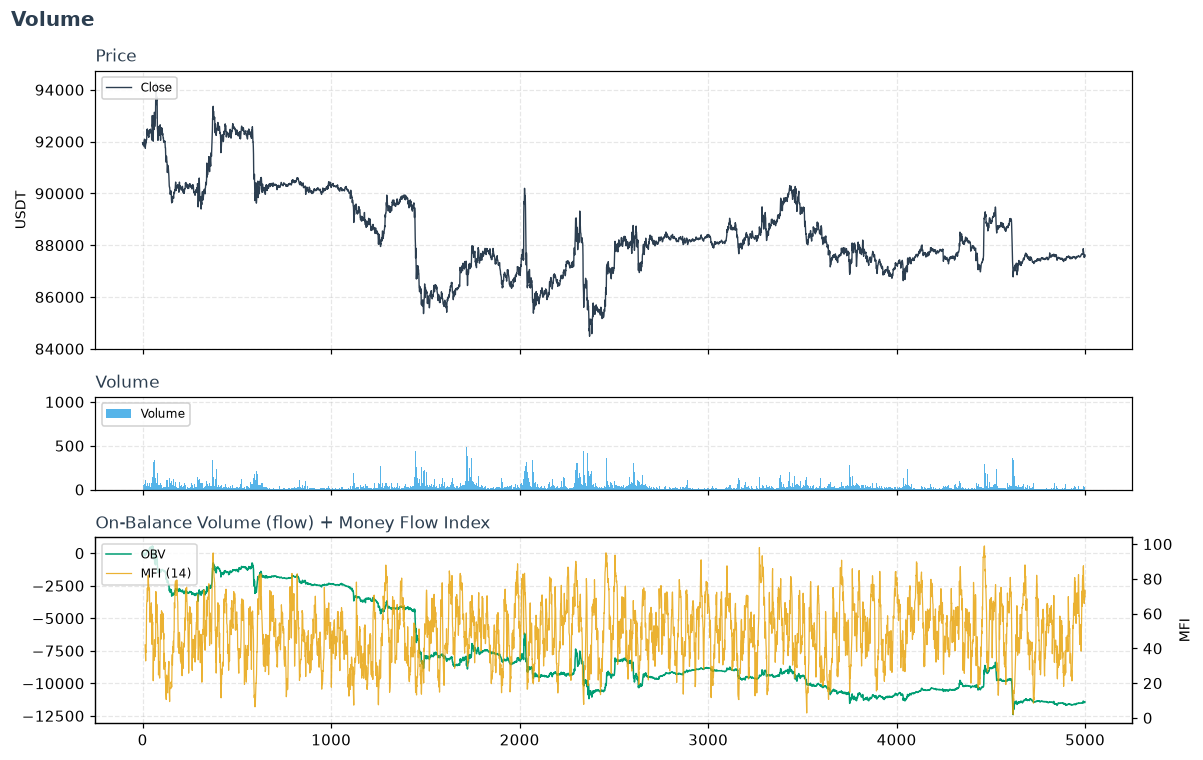
Volume indicators answer: is the price move backed by real participation, or is it hollow? Volume is the fuel behind price. These tools combine price and volume to reveal accumulation vs. distribution and to flag moves that lack conviction (a breakout on thin volume is suspect).
Cumulative flow (accumulation vs. distribution)
on_balance_volume— adds volume on up days, subtracts on down days. The simplest running tally of buying vs. selling pressure. Start here.acc_dist_index— like OBV but weights each bar by where it closed in its range, so a strong close counts more than a weak one.chaikin_ad_oscillator— a MACD on the A/D line. Because the A/D line is a cumulative sum, its level depends on where your data happens to start and only its slope carries information; taking the difference of two EMAs extracts that slope, giving a reading that is comparable over time in a way the raw line is not.volume_price_trend/negative_volume_index— VPT scales the flow by the size of the return; NVI tracks what "smart money" does on quiet (low-volume) days.
Flow oscillators & pressure
chaikin_money_flow— accumulation/ distribution as a bounded oscillator over a window; positive = buying pressure.money_flow_index— a volume-weighted RSI (0–100): overbought/oversold that also requires volume to confirm.force_index— combines the size of a move with its volume to gauge the power behind it.klinger_volume_oscillator— a long/short-term volume-force difference aimed at spotting reversals.
Movement efficiency & fair price
ease_of_movement/sma_ease_of_movement— how far price moved per unit of volume: big moves on light volume score high (price moves "easily").volume_weighted_average_price— VWAP, the execution benchmark: the average price weighted by volume, i.e. where the bulk of trading actually happened.
Confirm, don't lead
Volume tools are best as confirmation: a price breakout with rising OBV/CMF is trustworthy; the same breakout with falling volume flow often fails.
staticmethod

klinger_volume_oscillator(high: str | Expr, low: str | Expr, close: str | Expr, volume: str | Expr, window_fast: int = 34, window_slow: int = 55, fillna: bool = False) -> Expr
Klinger Volume Oscillator: signed volume force (volume * trend direction * daily-range-vs-3-day-range factor), EMA-smoothed at two speeds and differenced — a volume-based trend-confirmation oscillator.
Source code in polars_ta/volume.py
273 274 275 276 277 278 279 280 281 282 283 284 285 286 287 288 289 290 291 292 293 294 295 296 297 298 299 300 301 302 303 304 305 306 307 308 309 310 311 312 313 314 315 316 317 318 319 320 321 322 323 324 325 326 327 | |
staticmethod

chaikin_ad_oscillator(high: str | Expr, low: str | Expr, close: str | Expr, volume: str | Expr, window_fast: int = 3, window_slow: int = 10, fillna: bool = False) -> Expr
Chaikin A/D Oscillator (ADOSC) — MACD applied to the A/D line.
acc_dist_index is a cumulative sum,
so its level is an artifact of where the series starts and only its
slope carries information. Taking the difference of two EMAs of that
line extracts the slope, which makes ADOSC comparable over time in a
way the raw A/D line is not.
Source code in polars_ta/volume.py
332 333 334 335 336 337 338 339 340 341 342 343 344 345 346 347 348 349 350 351 352 353 | |