Skip to content

Momentum

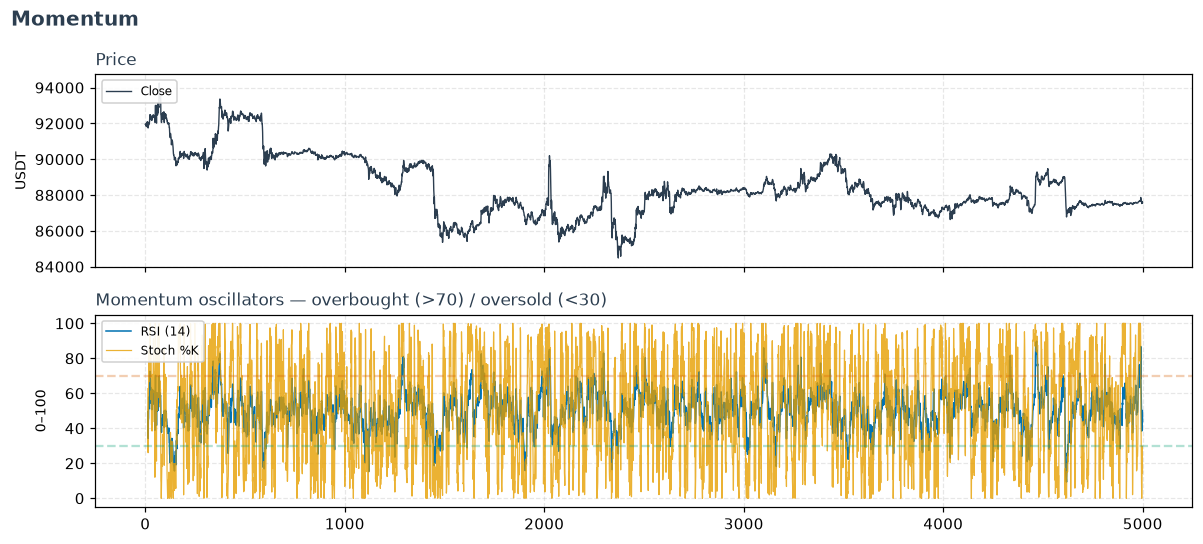
RSI and Stochastic oscillators on BTCUSDT 5m price, with overbought/oversold guides

Momentum indicators answer one question: is the current move accelerating or running out of fuel? They're oscillators — bounded or centred measures of the speed of price change rather than its direction — so they shine at spotting exhaustion (overbought/oversold) and divergence (price makes a new high, momentum doesn't) rather than at telling you the trend.

Which one to reach for

  • rsi — the default overbought/oversold gauge (0–100, Wilder-smoothed). Start here.
  • stoch / stoch_signal — where price closes within its recent high-low range; faster and twitchier than RSI, good in rangebound markets.
  • stochrsi — the stochastic of RSI: even more sensitive, for very short horizons.
  • williams_r — the stochastic's mirror image (−100 to 0); same information, different convention.
  • tsi / cmo — double-smoothed / range-normalised momentum that filter noise better than raw RSI.
  • ppo / pvo — MACD expressed in percent, so momentum is comparable across instruments at very different price levels (price PPO; volume PVO).
  • roc — the rawest momentum: plain percent change over n bars.
  • mom — the same idea in price units (close - close[n]) rather than percent. Not comparable across instruments, but it never divides by a near-zero price.
  • apo — the absolute-units counterpart of ppo: fast EMA minus slow EMA, same construction as MACD.
  • bop — Balance of Power, (close - open) / (high - low). Where the bar closed relative to how far it travelled, in [-1, 1] — the only momentum indicator here that uses the open, which makes it a natural companion to the candlestick patterns.
  • kama — an adaptive moving average that speeds up in trends and flattens in chop; part MA, part momentum filter.
  • awesome_oscillator / fisher_transform / ultimate_oscillator — specialised variants (median-price momentum; a Gaussianising transform that sharpens turning points; a multi-timeframe blend that resists false divergences).

Momentum ≠ direction

An oscillator being "overbought" is not a sell signal in a strong uptrend — it can stay pinned for a long time. Pair momentum with a trend or regime filter before acting on extremes.


polars_ta.momentum

MomentumIndicators

cmo staticmethod

cmo(close: str | Expr, window: int = 14, fillna: bool = False) -> Expr

Chande Momentum Oscillator: 100 * (sum(up) - sum(down)) / (sum(up) + sum(down)) over the window, unlike RSI's smoothed averages.

Source code in polars_ta/momentum.py
420
421
422
423
424
425
426
427
428
429
430
431
432
433
434
435
436
@staticmethod
def cmo(close: str | pl.Expr, window: int = 14, fillna: bool = False) -> pl.Expr:
    """Chande Momentum Oscillator: 100 * (sum(up) - sum(down)) / (sum(up)
    + sum(down)) over the window, unlike RSI's smoothed averages."""
    close = as_expr(close)
    min_periods = 1 if fillna else window

    diff = close.diff(1)
    up = pl.when(diff > 0).then(diff).otherwise(0.0)
    down = pl.when(diff < 0).then(-diff).otherwise(0.0)

    sum_up = up.rolling_sum(window_size=window, min_samples=min_periods)
    sum_down = down.rolling_sum(window_size=window, min_samples=min_periods)
    total = sum_up + sum_down

    cmo = pl.when(total == 0).then(0.0).otherwise(100 * (sum_up - sum_down) / total)
    return BaseIndicator.check_fillna(cmo, fillna, value=0)

fisher_transform staticmethod

fisher_transform(high: str | Expr, low: str | Expr, window: int = 9, fillna: bool = False) -> Expr

Ehlers' Fisher Transform: maps a bounded price-position oscillator through atanh to produce sharper, more Gaussian-distributed turning points than the underlying stochastic-style oscillator.

Ehlers' original formula EMA-smooths the normalized price position (value = 0.33 * 2*(...) + 0.67 * value[1]) before the atanh step, and smooths the Fisher output itself the same way. Skipping that damping — feeding the raw, unsmoothed position straight into atanh — saturates the output near the clip boundary on real, noisy data (price sits at the rolling high/low far more often than the idealized derivation assumes), producing a square-wave-like series instead of the intended smooth oscillator. map_batches carries the two damped recursions; everything upstream is vectorized.

Source code in polars_ta/momentum.py
441
442
443
444
445
446
447
448
449
450
451
452
453
454
455
456
457
458
459
460
461
462
463
464
465
466
467
468
469
470
471
472
473
474
475
476
477
478
479
480
481
482
483
484
485
486
487
488
489
490
491
492
493
494
@staticmethod
def fisher_transform(
    high: str | pl.Expr,
    low: str | pl.Expr,
    window: int = 9,
    fillna: bool = False,
) -> pl.Expr:
    """Ehlers' Fisher Transform: maps a bounded price-position oscillator
    through `atanh` to produce sharper, more Gaussian-distributed turning
    points than the underlying stochastic-style oscillator.

    Ehlers' original formula EMA-smooths the normalized price position
    (`value = 0.33 * 2*(...) + 0.67 * value[1]`) *before* the `atanh`
    step, and smooths the Fisher output itself the same way. Skipping
    that damping — feeding the raw, unsmoothed position straight into
    `atanh` — saturates the output near the clip boundary on real,
    noisy data (price sits at the rolling high/low far more often than
    the idealized derivation assumes), producing a square-wave-like
    series instead of the intended smooth oscillator. `map_batches`
    carries the two damped recursions; everything upstream is vectorized.
    """
    high = as_expr(high)
    low = as_expr(low)
    min_periods = 1 if fillna else window

    hl2 = (high + low) / 2.0
    lowest = hl2.rolling_min(window_size=window, min_samples=min_periods)
    highest = hl2.rolling_max(window_size=window, min_samples=min_periods)

    price_range = highest - lowest
    raw = (
        pl.when(price_range == 0)
        .then(0.0)
        .otherwise(2.0 * (hl2 - lowest) / price_range - 1.0)
    )

    def _calc_fisher(s: pl.Series) -> pl.Series:
        raw_arr = s.to_numpy()
        n = len(raw_arr)
        value = 0.0
        fish = 0.0
        out = np.full(n, np.nan)
        for i in range(n):
            r = raw_arr[i]
            if np.isnan(r):
                continue
            value = 0.33 * r + 0.67 * value
            value = min(max(value, -0.999), 0.999)
            fish = 0.5 * np.log((1 + value) / (1 - value)) + 0.5 * fish
            out[i] = fish
        return pl.Series(out).fill_nan(None)

    fisher = raw.map_batches(_calc_fisher, returns_scalar=False)
    return BaseIndicator.check_fillna(fisher, fillna, value=0)

mom staticmethod

mom(close: str | Expr, window: int = 10, fillna: bool = False) -> Expr

Momentum — close - close[window bars ago].

The rawest momentum measure there is. Unlike roc it stays in price units, so it is not comparable across instruments — but that also means it never divides by a near-zero price.

Source code in polars_ta/momentum.py
499
500
501
502
503
504
505
506
507
508
509
@staticmethod
def mom(close: str | pl.Expr, window: int = 10, fillna: bool = False) -> pl.Expr:
    """Momentum — `close - close[window bars ago]`.

    The rawest momentum measure there is. Unlike
    `roc` it stays in price units, so it is not
    comparable across instruments — but that also means it never divides by
    a near-zero price.
    """
    close = as_expr(close)
    return BaseIndicator.check_fillna(close - close.shift(window), fillna, value=0)

apo staticmethod

apo(close: str | Expr, window_slow: int = 26, window_fast: int = 12, fillna: bool = False) -> Expr

Absolute Price Oscillator (APO) — fast EMA minus slow EMA.

The same construction as MACD, and the absolute-units counterpart of ppo. Because it is denominated in price, readings are not comparable across instruments or across long spans where the price level has changed materially.

Source code in polars_ta/momentum.py
511
512
513
514
515
516
517
518
519
520
521
522
523
524
525
526
527
528
@staticmethod
def apo(
    close: str | pl.Expr,
    window_slow: int = 26,
    window_fast: int = 12,
    fillna: bool = False,
) -> pl.Expr:
    """Absolute Price Oscillator (APO) — fast EMA minus slow EMA.

    The same construction as MACD, and the absolute-units counterpart of
    `ppo`. Because it is denominated in price,
    readings are not comparable across instruments or across long spans
    where the price level has changed materially.
    """
    close = as_expr(close)
    emafast = BaseIndicator.ema(close, window_fast, fillna)
    emaslow = BaseIndicator.ema(close, window_slow, fillna)
    return BaseIndicator.check_fillna(emafast - emaslow, fillna, value=0)

bop staticmethod

bop(open_: str | Expr, high: str | Expr, low: str | Expr, close: str | Expr, fillna: bool = False) -> Expr

Balance of Power (BOP) — (close - open) / (high - low).

Where the bar closed relative to how far it travelled, in [-1, 1]: +1 means buyers held the entire range, -1 means sellers did. A zero-range bar is undefined and returns null rather than dividing by zero.

Source code in polars_ta/momentum.py
530
531
532
533
534
535
536
537
538
539
540
541
542
543
544
545
546
547
548
549
550
551
552
@staticmethod
def bop(
    open_: str | pl.Expr,
    high: str | pl.Expr,
    low: str | pl.Expr,
    close: str | pl.Expr,
    fillna: bool = False,
) -> pl.Expr:
    """Balance of Power (BOP) — `(close - open) / (high - low)`.

    Where the bar closed relative to how far it travelled, in `[-1, 1]`:
    `+1` means buyers held the entire range, `-1` means sellers did. A
    zero-range bar is undefined and returns null rather than dividing by
    zero.
    """
    open_ = as_expr(open_)
    high = as_expr(high)
    low = as_expr(low)
    close = as_expr(close)

    hl_range = high - low
    safe_range = pl.when(hl_range == 0).then(None).otherwise(hl_range)
    return BaseIndicator.check_fillna((close - open_) / safe_range, fillna, value=0)