Volatility
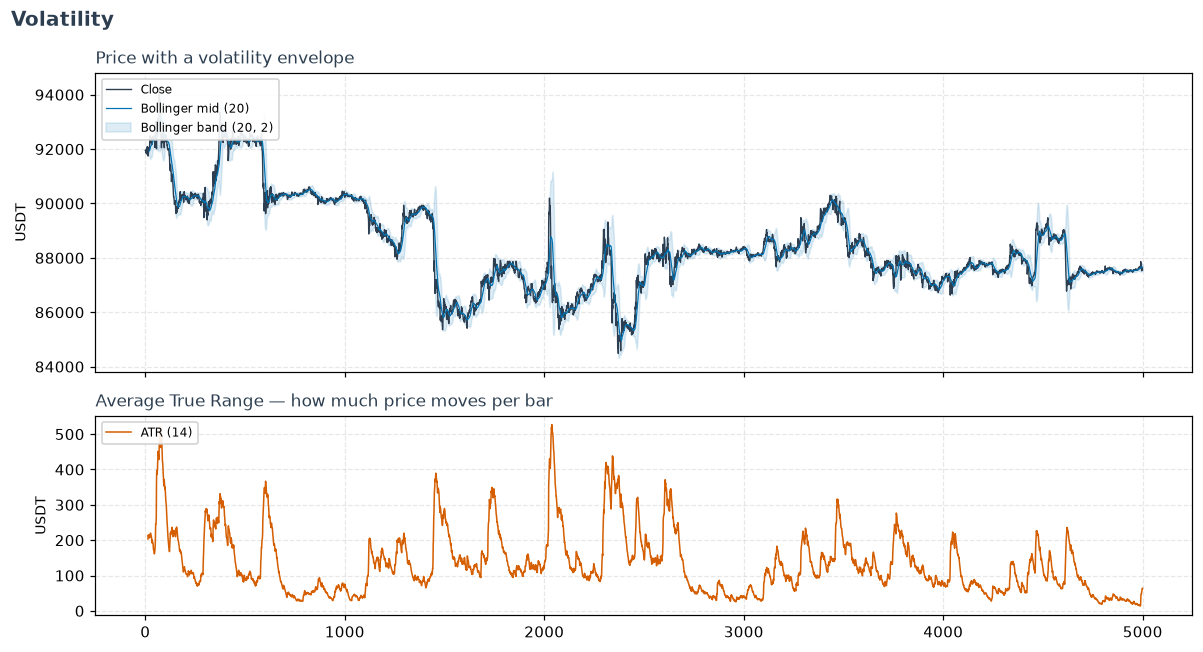
Volatility indicators answer: how much is price moving — and is that movement expanding or contracting? They drive position sizing (risk more when quiet, less when wild), adaptive stops, and breakout detection (a volatility squeeze often precedes a large move).
Range & true-range measures
average_true_range— the canonical volatility unit. True range accounts for gaps, so ATR is the natural scale for stops and for normalising signals across instruments. Start here.true_range— the per-bar quantity ATR averages, exposed on its own:max(high - low, |high - prev_close|, |low - prev_close|). Use it when you want the raw bar-level number rather than a smoothed one.normalized_average_true_range— ATR as a percent of price (NATR). Raw ATR is in price units, so a $2 ATR means something very different at $20 than at $2,000; NATR is the version you want when ranking or thresholding volatility across symbols, or comparing one symbol across a period where its price level moved a lot.ulcer_index— a downside-only volatility: depth and duration of drawdowns, closer to felt risk than symmetric measures.
Bands & channels (mean ± a volatility envelope)
- Bollinger Bands —
mavg ± k·σ. Usebollinger_wbandto detect squeezes (narrow band → pending breakout) andbollinger_pbandas a 0–1 mean-reversion signal (where price sits in the band). - Keltner Channel — like Bollinger but banded by ATR instead of standard deviation, so it reacts to gaps rather than closing dispersion. Bollinger-inside-Keltner is the classic squeeze setup.
- Donchian Channel — the rolling high/low envelope; the basis of breakout systems (the "Turtle" channel).
Each band family exposes the high / low / mid bands plus a width (_wband,
for squeeze detection) and a position (_pband, 0–1 within the band), and
the _indicator variants flag band touches.
OHLC volatility estimators live in Quant
Range-based estimators that squeeze more information out of each bar — Parkinson, Garman-Klass, Rogers-Satchell, Yang-Zhang, EWMA/RiskMetrics — are in Quant, since they're aimed at volatility forecasting / risk rather than charting.
staticmethod

average_true_range(high: str | Expr, low: str | Expr, close: str | Expr, window: int = 14, fillna: bool = False) -> Expr
Average True Range (ATR)
Source code in polars_ta/volatility.py
11 12 13 14 15 16 17 18 19 20 21 22 23 24 25 26 27 28 29 30 31 32 33 | |
staticmethod

ulcer_index(close: str | Expr, window: int = 14, fillna: bool = False) -> Expr
Ulcer Index (UI) - fully vectorized!
Source code in polars_ta/volatility.py
438 439 440 441 442 443 444 445 446 447 448 449 450 451 452 453 454 455 | |
staticmethod

true_range(high: str | Expr, low: str | Expr, close: str | Expr, fillna: bool = False) -> Expr
True Range — the per-bar range ATR averages.
max(high - low, |high - prev_close|,
  |low - prev_close|)
. Unlike a
plain high-low range it accounts for gaps, since a bar that opens far
from the previous close really did travel that distance.
Source code in polars_ta/volatility.py
460 461 462 463 464 465 466 467 468 469 470 471 472 473 474 475 476 477 | |
staticmethod

normalized_average_true_range(high: str | Expr, low: str | Expr, close: str | Expr, window: int = 14, fillna: bool = False) -> Expr
Normalized Average True Range (NATR) — ATR as a percent of price.
Raw ATR is in price units, so it is not comparable across instruments or across periods where the price level moved a lot: a $2 ATR means something very different at $20 than at $2,000. Dividing by close fixes that, which matters most on the multi-asset frames this library targets — NATR is what you want when ranking or thresholding volatility across symbols.
Source code in polars_ta/volatility.py
479 480 481 482 483 484 485 486 487 488 489 490 491 492 493 494 495 496 497 498 499 500 501 502 503 504 | |