Skip to content

Trend

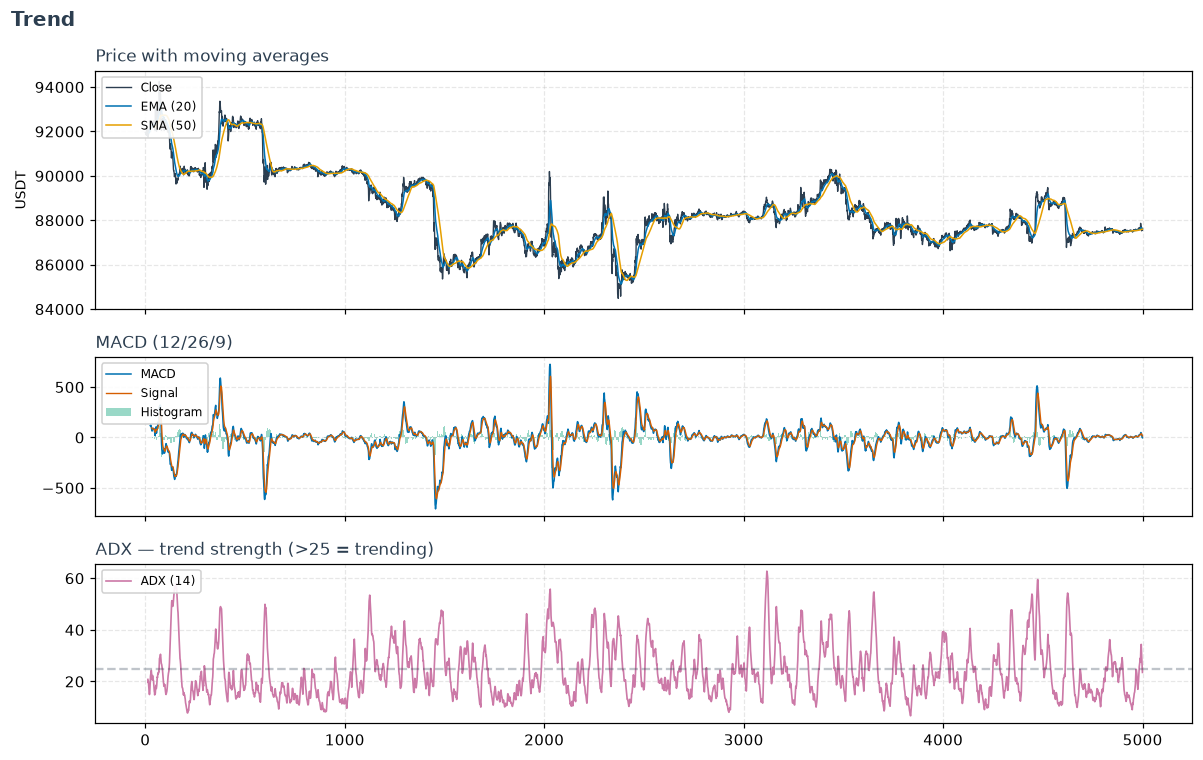
Price with EMA/SMA, MACD, and ADX trend-strength on BTCUSDT 5m

Trend indicators answer: which way is price heading, and how strongly? Where momentum measures speed, trend tools estimate direction and persistence — the smoothed path, its slope, and whether a directional move is worth following or is just noise.

Moving averages — the building blocks

  • sma_indicator — the plain average; simple, laggy.
  • ema_indicator — weights recent bars more, so it turns faster than the SMA.
  • wma_indicator / hull_moving_average — the WMA and the Hull MA cut lag further; the Hull is the smoothest-yet-responsive of the set.
  • dema / tema — the lag-cancelling pair. An EMA always trails price; DEMA estimates that lag with a second EMA and subtracts it (2*EMA - EMA(EMA)), and TEMA carries the idea one order further. On a constant-slope move they track it exactly, where an EMA never catches up — the trade is overshoot at sharp reversals.
  • t3 — Tillson's T3: six chained EMAs recombined via a v_factor (default 0.7) that dials between smoothness and responsiveness. Smoother than DEMA/TEMA while keeping much of their speed.
  • trima — the opposite trade: an SMA of an SMA, weighting the middle of the window most. Smoother and laggier than an SMA, useful when you want a stable baseline rather than a fast one.

Picking a moving average

Lag and smoothness are a single dial, and each average here sits somewhere on it: trimasmaemat3hulldematema, roughly from laggiest-smoothest to fastest-noisiest. Faster is not better; a fast MA on noisy data mostly produces whipsaws.

Direction & strength

  • macd / macd_signal / macd_diff — the workhorse: the gap between a fast and slow EMA (line), its own EMA (signal), and their difference (histogram, an early momentum-of-trend read).
  • adx + adx_pos / adx_neg — ADX measures trend strength regardless of direction; the ±DI pair supplies the direction. The single best "should I even be trend-following right now?" gate.
  • dx / adxr / plus_dm / minus_dm — the rest of Wilder's directional ladder, exposed separately because each stage is useful on its own. Raw plus_dm/minus_dm keep the magnitude of directional movement that ±DI normalizes away; dx is ADX before its final smoothing, so it reacts a full period sooner at the cost of noise; adxr averages ADX with its value window bars ago, smoothing further to show whether trend strength is building or fading.
  • aroon_up / aroon_down — how recently the window's high / low was set; a clean way to detect the start of a new trend.
  • vortex_indicator_pos / vortex_indicator_neg — trend direction from the relationship between consecutive highs and lows.

Trend-following systems & filters

  • psar — Parabolic SAR: a trailing stop-and-reverse dot that also marks the trend side.
  • supertrend — an ATR-banded trend line; a popular, readable stop/entry rail.
  • ichimoku_a / ichimoku_b and the conversion/base lines — a whole trend-and-support system in one overlay (the "cloud").
  • cci / trix / dpo / kst / stc / mass_index — oscillator-style trend measures: deviation from the mean (CCI), triple-smoothed rate of change (TRIX), a detrended price cycle (DPO), a summed multi-timeframe momentum (KST), a Schaff cycle (STC), and a range-expansion reversal warning (Mass Index).
  • elder_bull_power / elder_bear_power — how far buyers / sellers push price beyond a baseline EMA.

Gate momentum with trend strength

A classic combination: use adx to decide whether the market is trending, then follow macd when it is and fade a momentum oscillator when it isn't. See the regime-conditional switch.


polars_ta.trend

TrendIndicators

Trend Indicators translated to Polars Expressions.

aroon_up staticmethod

aroon_up(high: str | Expr, window: int = 25, fillna: bool = False) -> Expr

Aroon Up Channel

Source code in polars_ta/trend.py
15
16
17
18
19
20
21
22
23
24
25
26
27
28
29
@staticmethod
def aroon_up(
    high: str | pl.Expr, window: int = 25, fillna: bool = False
) -> pl.Expr:
    """Aroon Up Channel"""
    high = as_expr(high)
    min_periods = 1 if fillna else window + 1

    # rolling_map allows us to run the argmax logic on each window slice
    expr = high.rolling_map(
        lambda s: float(s.to_numpy().argmax()) / window * 100,
        window_size=window + 1,
        min_samples=min_periods,
    )
    return BaseIndicator.check_fillna(expr, fillna, value=0)

aroon_down staticmethod

aroon_down(low: str | Expr, window: int = 25, fillna: bool = False) -> Expr

Aroon Down Channel

Source code in polars_ta/trend.py
31
32
33
34
35
36
37
38
39
40
41
42
43
44
@staticmethod
def aroon_down(
    low: str | pl.Expr, window: int = 25, fillna: bool = False
) -> pl.Expr:
    """Aroon Down Channel"""
    low = as_expr(low)
    min_periods = 1 if fillna else window + 1

    expr = low.rolling_map(
        lambda s: float(s.to_numpy().argmin()) / window * 100,
        window_size=window + 1,
        min_samples=min_periods,
    )
    return BaseIndicator.check_fillna(expr, fillna, value=0)

aroon_indicator staticmethod

aroon_indicator(high: str | Expr, low: str | Expr, window: int = 25, fillna: bool = False) -> Expr

Aroon Indicator (Up - Down)

Source code in polars_ta/trend.py
46
47
48
49
50
51
52
53
54
@staticmethod
def aroon_indicator(
    high: str | pl.Expr, low: str | pl.Expr, window: int = 25, fillna: bool = False
) -> pl.Expr:
    """Aroon Indicator (Up - Down)"""
    up = TrendIndicators.aroon_up(high, window, fillna)
    down = TrendIndicators.aroon_down(low, window, fillna)
    diff = up - down
    return BaseIndicator.check_fillna(diff, fillna, value=0)

macd staticmethod

macd(close: str | Expr, window_slow: int = 26, window_fast: int = 12, fillna: bool = False) -> Expr

MACD Line

Source code in polars_ta/trend.py
59
60
61
62
63
64
65
66
67
68
69
70
71
@staticmethod
def macd(
    close: str | pl.Expr,
    window_slow: int = 26,
    window_fast: int = 12,
    fillna: bool = False,
) -> pl.Expr:
    """MACD Line"""
    close = as_expr(close)
    ema_fast = BaseIndicator.ema(close, window_fast, fillna)
    ema_slow = BaseIndicator.ema(close, window_slow, fillna)
    macd_line = ema_fast - ema_slow
    return BaseIndicator.check_fillna(macd_line, fillna, value=0)

macd_signal staticmethod

macd_signal(close: str | Expr, window_slow: int = 26, window_fast: int = 12, window_sign: int = 9, fillna: bool = False) -> Expr

MACD Signal Line

Source code in polars_ta/trend.py
73
74
75
76
77
78
79
80
81
82
83
84
@staticmethod
def macd_signal(
    close: str | pl.Expr,
    window_slow: int = 26,
    window_fast: int = 12,
    window_sign: int = 9,
    fillna: bool = False,
) -> pl.Expr:
    """MACD Signal Line"""
    macd_line = TrendIndicators.macd(close, window_slow, window_fast, fillna)
    signal_line = BaseIndicator.ema(macd_line, window_sign, fillna)
    return BaseIndicator.check_fillna(signal_line, fillna, value=0)

macd_diff staticmethod

macd_diff(close: str | Expr, window_slow: int = 26, window_fast: int = 12, window_sign: int = 9, fillna: bool = False) -> Expr

MACD Histogram

Source code in polars_ta/trend.py
 86
 87
 88
 89
 90
 91
 92
 93
 94
 95
 96
 97
 98
 99
100
@staticmethod
def macd_diff(
    close: str | pl.Expr,
    window_slow: int = 26,
    window_fast: int = 12,
    window_sign: int = 9,
    fillna: bool = False,
) -> pl.Expr:
    """MACD Histogram"""
    macd_line = TrendIndicators.macd(close, window_slow, window_fast, fillna)
    signal_line = TrendIndicators.macd_signal(
        close, window_slow, window_fast, window_sign, fillna
    )
    diff_line = macd_line - signal_line
    return BaseIndicator.check_fillna(diff_line, fillna, value=0)

ema_indicator staticmethod

ema_indicator(close: str | Expr, window: int = 14, fillna: bool = False) -> Expr

Exponential Moving Average (EMA)

Source code in polars_ta/trend.py
105
106
107
108
109
110
@staticmethod
def ema_indicator(
    close: str | pl.Expr, window: int = 14, fillna: bool = False
) -> pl.Expr:
    """Exponential Moving Average (EMA)"""
    return BaseIndicator.ema(close, window, fillna)

sma_indicator staticmethod

sma_indicator(close: str | Expr, window: int, fillna: bool = False) -> Expr

Simple Moving Average (SMA)

Source code in polars_ta/trend.py
112
113
114
115
116
117
@staticmethod
def sma_indicator(
    close: str | pl.Expr, window: int, fillna: bool = False
) -> pl.Expr:
    """Simple Moving Average (SMA)"""
    return BaseIndicator.sma(close, window, fillna)

wma_indicator staticmethod

wma_indicator(close: str | Expr, window: int = 9, fillna: bool = False) -> Expr

Weighted Moving Average (WMA)

Source code in polars_ta/trend.py
122
123
124
125
126
127
128
129
130
131
132
133
134
135
136
137
138
@staticmethod
def wma_indicator(
    close: str | pl.Expr, window: int = 9, fillna: bool = False
) -> pl.Expr:
    """Weighted Moving Average (WMA)"""
    close = as_expr(close)

    # Pre-calculate weights array exactly as the original does
    weights = np.array(
        [i * 2 / (window * (window + 1)) for i in range(1, window + 1)]
    )

    # Apply the weighted dot product over the rolling window
    expr = close.rolling_map(
        lambda s: np.dot(s.to_numpy(), weights), window_size=window
    )
    return BaseIndicator.check_fillna(expr, fillna, value=0)

dema staticmethod

dema(close: str | Expr, window: int = 30, fillna: bool = False) -> Expr

Double Exponential Moving Average (DEMA).

2 * EMA - EMA(EMA). The second term estimates the EMA's own lag, so subtracting it lets DEMA track price far more closely than an EMA of the same window — at the cost of overshooting sharp reversals.

Source code in polars_ta/trend.py
148
149
150
151
152
153
154
155
156
157
158
159
@staticmethod
def dema(close: str | pl.Expr, window: int = 30, fillna: bool = False) -> pl.Expr:
    """Double Exponential Moving Average (DEMA).

    `2 * EMA - EMA(EMA)`. The second term estimates the EMA's own lag, so
    subtracting it lets DEMA track price far more closely than an EMA of
    the same window — at the cost of overshooting sharp reversals.
    """
    close = as_expr(close)
    ema1 = BaseIndicator.ema(close, window, fillna)
    ema2 = BaseIndicator.ema(ema1, window, fillna)
    return BaseIndicator.check_fillna(2.0 * ema1 - ema2, fillna, value=0)

tema staticmethod

tema(close: str | Expr, window: int = 30, fillna: bool = False) -> Expr

Triple Exponential Moving Average (TEMA).

3*EMA - 3*EMA(EMA) + EMA(EMA(EMA)) — the same lag-cancelling idea as DEMA carried one order further, so it is faster still and noisier still.

Source code in polars_ta/trend.py
161
162
163
164
165
166
167
168
169
170
171
172
173
@staticmethod
def tema(close: str | pl.Expr, window: int = 30, fillna: bool = False) -> pl.Expr:
    """Triple Exponential Moving Average (TEMA).

    `3*EMA - 3*EMA(EMA) + EMA(EMA(EMA))` — the same lag-cancelling idea as
    DEMA carried one order further, so it is faster still and noisier still.
    """
    close = as_expr(close)
    ema1 = BaseIndicator.ema(close, window, fillna)
    ema2 = BaseIndicator.ema(ema1, window, fillna)
    ema3 = BaseIndicator.ema(ema2, window, fillna)
    tema_val = 3.0 * ema1 - 3.0 * ema2 + ema3
    return BaseIndicator.check_fillna(tema_val, fillna, value=0)

trima staticmethod

trima(close: str | Expr, window: int = 30, fillna: bool = False) -> Expr

Triangular Moving Average (TRIMA).

An SMA of an SMA, which weights the middle of the window most heavily. Smoother and laggier than an SMA — the opposite trade to DEMA/TEMA. Matches TA-Lib's split of an odd window into (n+1)/2 twice, and an even window into n/2 + 1 then n/2.

Source code in polars_ta/trend.py
175
176
177
178
179
180
181
182
183
184
185
186
187
188
189
190
191
@staticmethod
def trima(close: str | pl.Expr, window: int = 30, fillna: bool = False) -> pl.Expr:
    """Triangular Moving Average (TRIMA).

    An SMA of an SMA, which weights the *middle* of the window most
    heavily. Smoother and laggier than an SMA — the opposite trade to
    DEMA/TEMA. Matches TA-Lib's split of an odd window into
    `(n+1)/2` twice, and an even window into `n/2 + 1` then `n/2`.
    """
    close = as_expr(close)
    if window % 2 == 1:
        first = second = (window + 1) // 2
    else:
        first, second = window // 2 + 1, window // 2
    inner = BaseIndicator.sma(close, first, fillna)
    smoothed = BaseIndicator.sma(inner, second, fillna)
    return BaseIndicator.check_fillna(smoothed, fillna, value=0)

t3 staticmethod

t3(close: str | Expr, window: int = 5, v_factor: float = 0.7, fillna: bool = False) -> Expr

Tillson T3 moving average.

Six chained EMAs recombined with weights derived from v_factor. The result is smoother than a DEMA/TEMA of the same window while keeping much of their responsiveness.

Parameters:

Name Type Description Default
close str | Expr

Price series.

required
window int

EMA period used for every stage.

5
v_factor float

Volume factor in [0, 1]. 0 degenerates to a plain six-fold EMA; 1 makes T3 equivalent to a TEMA-like response. TA-Lib's default is 0.7.

0.7
fillna bool

Forward-fill gaps when True.

False
Source code in polars_ta/trend.py
193
194
195
196
197
198
199
200
201
202
203
204
205
206
207
208
209
210
211
212
213
214
215
216
217
218
219
220
221
222
223
224
225
226
227
228
@staticmethod
def t3(
    close: str | pl.Expr,
    window: int = 5,
    v_factor: float = 0.7,
    fillna: bool = False,
) -> pl.Expr:
    """Tillson T3 moving average.

    Six chained EMAs recombined with weights derived from `v_factor`. The
    result is smoother than a DEMA/TEMA of the same window while keeping
    much of their responsiveness.

    Args:
        close: Price series.
        window: EMA period used for every stage.
        v_factor: Volume factor in `[0, 1]`. `0` degenerates to a plain
            six-fold EMA; `1` makes T3 equivalent to a TEMA-like response.
            TA-Lib's default is `0.7`.
        fillna: Forward-fill gaps when True.
    """
    close = as_expr(close)
    e1 = BaseIndicator.ema(close, window, fillna)
    e2 = BaseIndicator.ema(e1, window, fillna)
    e3 = BaseIndicator.ema(e2, window, fillna)
    e4 = BaseIndicator.ema(e3, window, fillna)
    e5 = BaseIndicator.ema(e4, window, fillna)
    e6 = BaseIndicator.ema(e5, window, fillna)

    v = v_factor
    c1 = -(v**3)
    c2 = 3.0 * v**2 + 3.0 * v**3
    c3 = -6.0 * v**2 - 3.0 * v - 3.0 * v**3
    c4 = 1.0 + 3.0 * v + v**3 + 3.0 * v**2
    t3_val = c1 * e6 + c2 * e5 + c3 * e4 + c4 * e3
    return BaseIndicator.check_fillna(t3_val, fillna, value=0)

trix staticmethod

trix(close: str | Expr, window: int = 15, fillna: bool = False) -> Expr

Trix (TRIX) - Triple exponentially smoothed moving average percent change

Source code in polars_ta/trend.py
233
234
235
236
237
238
239
240
241
242
243
244
245
246
247
248
@staticmethod
def trix(close: str | pl.Expr, window: int = 15, fillna: bool = False) -> pl.Expr:
    """Trix (TRIX) - Triple exponentially smoothed moving average percent change"""
    close = as_expr(close)

    ema1 = BaseIndicator.ema(close, window, fillna)
    ema2 = BaseIndicator.ema(ema1, window, fillna)
    ema3 = BaseIndicator.ema(ema2, window, fillna)

    # Original: ema3.shift(1, fill_value=ema3.mean())
    ema3_mean = ema3.mean()
    shifted_ema3 = ema3.shift(1).fill_null(ema3_mean)

    trix_expr = ((ema3 - shifted_ema3) / shifted_ema3) * 100

    return BaseIndicator.check_fillna(trix_expr, fillna, value=0)

mass_index staticmethod

mass_index(high: str | Expr, low: str | Expr, window_fast: int = 9, window_slow: int = 25, fillna: bool = False) -> Expr

Mass Index (MI)

Source code in polars_ta/trend.py
250
251
252
253
254
255
256
257
258
259
260
261
262
263
264
265
266
267
268
269
270
271
@staticmethod
def mass_index(
    high: str | pl.Expr,
    low: str | pl.Expr,
    window_fast: int = 9,
    window_slow: int = 25,
    fillna: bool = False,
) -> pl.Expr:
    """Mass Index (MI)"""
    high = as_expr(high)
    low = as_expr(low)

    min_periods = 1 if fillna else window_slow

    amplitude = high - low
    ema1 = BaseIndicator.ema(amplitude, window_fast, fillna)
    ema2 = BaseIndicator.ema(ema1, window_fast, fillna)

    mass = ema1 / ema2
    mass_idx = mass.rolling_sum(window_size=window_slow, min_samples=min_periods)

    return BaseIndicator.check_fillna(mass_idx, fillna, value=0)

ichimoku_conversion_line staticmethod

ichimoku_conversion_line(high: str | Expr, low: str | Expr, window1: int = 9, fillna: bool = False) -> Expr

Tenkan-sen (Conversion Line)

Source code in polars_ta/trend.py
286
287
288
289
290
291
292
293
294
295
@staticmethod
def ichimoku_conversion_line(
    high: str | pl.Expr, low: str | pl.Expr, window1: int = 9, fillna: bool = False
) -> pl.Expr:
    """Tenkan-sen (Conversion Line)"""
    high = as_expr(high)
    low = as_expr(low)

    conv = TrendIndicators._ichimoku_line(high, low, window1, fillna)
    return BaseIndicator.check_fillna(conv, fillna, value=-1)

ichimoku_base_line staticmethod

ichimoku_base_line(high: str | Expr, low: str | Expr, window2: int = 26, fillna: bool = False) -> Expr

Kijun-sen (Base Line)

Source code in polars_ta/trend.py
297
298
299
300
301
302
303
304
305
306
@staticmethod
def ichimoku_base_line(
    high: str | pl.Expr, low: str | pl.Expr, window2: int = 26, fillna: bool = False
) -> pl.Expr:
    """Kijun-sen (Base Line)"""
    high = as_expr(high)
    low = as_expr(low)

    base = TrendIndicators._ichimoku_line(high, low, window2, fillna)
    return BaseIndicator.check_fillna(base, fillna, value=-1)

ichimoku_a staticmethod

ichimoku_a(high: str | Expr, low: str | Expr, window1: int = 9, window2: int = 26, visual: bool = False, fillna: bool = False) -> Expr

Senkou Span A (Leading Span A)

Source code in polars_ta/trend.py
308
309
310
311
312
313
314
315
316
317
318
319
320
321
322
323
324
325
326
327
328
@staticmethod
def ichimoku_a(
    high: str | pl.Expr,
    low: str | pl.Expr,
    window1: int = 9,
    window2: int = 26,
    visual: bool = False,
    fillna: bool = False,
) -> pl.Expr:
    """Senkou Span A (Leading Span A)"""
    high = as_expr(high)
    low = as_expr(low)

    conv = TrendIndicators._ichimoku_line(high, low, window1, fillna)
    base = TrendIndicators._ichimoku_line(high, low, window2, fillna)

    spana = 0.5 * (conv + base)
    if visual:
        spana = spana.shift(window2).fill_null(spana.mean())

    return BaseIndicator.check_fillna(spana, fillna, value=-1)

ichimoku_b staticmethod

ichimoku_b(high: str | Expr, low: str | Expr, window2: int = 26, window3: int = 52, visual: bool = False, fillna: bool = False) -> Expr

Senkou Span B (Leading Span B)

Source code in polars_ta/trend.py
330
331
332
333
334
335
336
337
338
339
340
341
342
343
344
345
346
347
348
349
@staticmethod
def ichimoku_b(
    high: str | pl.Expr,
    low: str | pl.Expr,
    window2: int = 26,
    window3: int = 52,
    visual: bool = False,
    fillna: bool = False,
) -> pl.Expr:
    """Senkou Span B (Leading Span B)"""
    high = as_expr(high)
    low = as_expr(low)

    # Span B uses the longest window (window3), shifted by window2 if visual
    spanb = TrendIndicators._ichimoku_line(high, low, window3, fillna)

    if visual:
        spanb = spanb.shift(window2).fill_null(spanb.mean())

    return BaseIndicator.check_fillna(spanb, fillna, value=-1)

kst staticmethod

kst(close: str | Expr, roc1: int = 10, roc2: int = 15, roc3: int = 20, roc4: int = 30, window1: int = 10, window2: int = 10, window3: int = 10, window4: int = 15, fillna: bool = False) -> Expr

Know Sure Thing (KST)

Source code in polars_ta/trend.py
354
355
356
357
358
359
360
361
362
363
364
365
366
367
368
369
370
371
372
373
374
375
376
377
378
379
380
381
382
383
@staticmethod
def kst(
    close: str | pl.Expr,
    roc1: int = 10,
    roc2: int = 15,
    roc3: int = 20,
    roc4: int = 30,
    window1: int = 10,
    window2: int = 10,
    window3: int = 10,
    window4: int = 15,
    fillna: bool = False,
) -> pl.Expr:
    """Know Sure Thing (KST)"""
    close = as_expr(close)

    def _rocma(r: int, w: int) -> pl.Expr:
        """Helper to calculate the Smoothed Rate of Change"""
        min_p = 1 if fillna else w
        shifted_close = close.shift(r).fill_null(close.mean())
        roc = (close - shifted_close) / shifted_close
        return roc.rolling_mean(window_size=w, min_samples=min_p)

    rocma1 = _rocma(roc1, window1)
    rocma2 = _rocma(roc2, window2)
    rocma3 = _rocma(roc3, window3)
    rocma4 = _rocma(roc4, window4)

    kst_val = 100 * (rocma1 + 2 * rocma2 + 3 * rocma3 + 4 * rocma4)
    return BaseIndicator.check_fillna(kst_val, fillna, value=0)

kst_sig staticmethod

kst_sig(close: str | Expr, roc1: int = 10, roc2: int = 15, roc3: int = 20, roc4: int = 30, window1: int = 10, window2: int = 10, window3: int = 10, window4: int = 15, nsig: int = 9, fillna: bool = False) -> Expr

Signal Line Know Sure Thing (KST)

Source code in polars_ta/trend.py
385
386
387
388
389
390
391
392
393
394
395
396
397
398
399
400
401
402
403
404
@staticmethod
def kst_sig(
    close: str | pl.Expr,
    roc1: int = 10,
    roc2: int = 15,
    roc3: int = 20,
    roc4: int = 30,
    window1: int = 10,
    window2: int = 10,
    window3: int = 10,
    window4: int = 15,
    nsig: int = 9,
    fillna: bool = False,
) -> pl.Expr:
    """Signal Line Know Sure Thing (KST)"""
    kst_val = TrendIndicators.kst(
        close, roc1, roc2, roc3, roc4, window1, window2, window3, window4, fillna
    )
    kst_sig_val = kst_val.rolling_mean(window_size=nsig, min_samples=1)
    return BaseIndicator.check_fillna(kst_sig_val, fillna, value=0)

kst_diff staticmethod

kst_diff(close: str | Expr, roc1: int = 10, roc2: int = 15, roc3: int = 20, roc4: int = 30, window1: int = 10, window2: int = 10, window3: int = 10, window4: int = 15, nsig: int = 9, fillna: bool = False) -> Expr

Diff Know Sure Thing (KST)

Source code in polars_ta/trend.py
406
407
408
409
410
411
412
413
414
415
416
417
418
419
420
421
422
423
424
425
426
427
428
429
430
431
432
433
434
435
436
437
438
439
@staticmethod
def kst_diff(
    close: str | pl.Expr,
    roc1: int = 10,
    roc2: int = 15,
    roc3: int = 20,
    roc4: int = 30,
    window1: int = 10,
    window2: int = 10,
    window3: int = 10,
    window4: int = 15,
    nsig: int = 9,
    fillna: bool = False,
) -> pl.Expr:
    """Diff Know Sure Thing (KST)"""
    kst_val = TrendIndicators.kst(
        close, roc1, roc2, roc3, roc4, window1, window2, window3, window4, fillna
    )
    kst_sig_val = TrendIndicators.kst_sig(
        close,
        roc1,
        roc2,
        roc3,
        roc4,
        window1,
        window2,
        window3,
        window4,
        nsig,
        fillna,
    )

    kst_diff_val = kst_val - kst_sig_val
    return BaseIndicator.check_fillna(kst_diff_val, fillna, value=0)

ComplexTrendIndicators

dpo staticmethod

dpo(close: str | Expr, window: int = 20, fillna: bool = False) -> Expr

Detrended Price Oscillator (DPO)

Source code in polars_ta/trend.py
446
447
448
449
450
451
452
453
454
455
456
457
458
@staticmethod
def dpo(close: str | pl.Expr, window: int = 20, fillna: bool = False) -> pl.Expr:
    """Detrended Price Oscillator (DPO)"""
    close = as_expr(close)
    min_periods = 1 if fillna else window

    # Shift back by (window / 2) + 1
    shift_val = int((0.5 * window) + 1)
    shifted_close = close.shift(shift_val).fill_null(close.mean())
    sma = close.rolling_mean(window_size=window, min_samples=min_periods)

    dpo_val = shifted_close - sma
    return BaseIndicator.check_fillna(dpo_val, fillna, value=0)

cci staticmethod

cci(high: str | Expr, low: str | Expr, close: str | Expr, window: int = 20, constant: float = 0.015, fillna: bool = False) -> Expr

Commodity Channel Index (CCI)

Source code in polars_ta/trend.py
463
464
465
466
467
468
469
470
471
472
473
474
475
476
477
478
479
480
481
482
483
484
485
486
487
488
489
@staticmethod
def cci(
    high: str | pl.Expr,
    low: str | pl.Expr,
    close: str | pl.Expr,
    window: int = 20,
    constant: float = 0.015,
    fillna: bool = False,
) -> pl.Expr:
    """Commodity Channel Index (CCI)"""
    high = as_expr(high)
    low = as_expr(low)
    close = as_expr(close)
    min_periods = 1 if fillna else window

    typical_price = (high + low + close) / 3.0
    tp_sma = typical_price.rolling_mean(window_size=window, min_samples=min_periods)

    # Polars rolling_map for Mean Absolute Deviation (MAD)
    mad = typical_price.rolling_map(
        lambda s: float(np.abs(s.to_numpy() - s.to_numpy().mean()).mean()),
        window_size=window,
        min_samples=min_periods,
    )

    cci_val = (typical_price - tp_sma) / (constant * mad)
    return BaseIndicator.check_fillna(cci_val, fillna, value=0)

vortex_pos staticmethod

vortex_pos(high: str | Expr, low: str | Expr, close: str | Expr, window: int = 14, fillna: bool = False) -> Expr

+VI (Positive Vortex Indicator)

Source code in polars_ta/trend.py
494
495
496
497
498
499
500
501
502
503
504
505
506
507
508
509
510
511
512
513
514
515
@staticmethod
def vortex_pos(
    high: str | pl.Expr,
    low: str | pl.Expr,
    close: str | pl.Expr,
    window: int = 14,
    fillna: bool = False,
) -> pl.Expr:
    """+VI (Positive Vortex Indicator)"""
    high = as_expr(high)
    low = as_expr(low)
    close = as_expr(close)
    min_periods = 1 if fillna else window

    close_shift = close.shift(1).fill_null(close.mean())
    true_range = BaseIndicator.true_range(high, low, close_shift)

    trn = true_range.rolling_sum(window_size=window, min_samples=min_periods)
    vmp = (high - low.shift(1)).abs()

    vip = vmp.rolling_sum(window_size=window, min_samples=min_periods) / trn
    return BaseIndicator.check_fillna(vip, fillna, value=1)

vortex_neg staticmethod

vortex_neg(high: str | Expr, low: str | Expr, close: str | Expr, window: int = 14, fillna: bool = False) -> Expr

-VI (Negative Vortex Indicator)

Source code in polars_ta/trend.py
517
518
519
520
521
522
523
524
525
526
527
528
529
530
531
532
533
534
535
536
537
538
@staticmethod
def vortex_neg(
    high: str | pl.Expr,
    low: str | pl.Expr,
    close: str | pl.Expr,
    window: int = 14,
    fillna: bool = False,
) -> pl.Expr:
    """-VI (Negative Vortex Indicator)"""
    high = as_expr(high)
    low = as_expr(low)
    close = as_expr(close)
    min_periods = 1 if fillna else window

    close_shift = close.shift(1).fill_null(close.mean())
    true_range = BaseIndicator.true_range(high, low, close_shift)

    trn = true_range.rolling_sum(window_size=window, min_samples=min_periods)
    vmm = (low - high.shift(1)).abs()

    vin = vmm.rolling_sum(window_size=window, min_samples=min_periods) / trn
    return BaseIndicator.check_fillna(vin, fillna, value=1)

vortex_diff staticmethod

vortex_diff(high: str | Expr, low: str | Expr, close: str | Expr, window: int = 14, fillna: bool = False) -> Expr

Diff VI

Source code in polars_ta/trend.py
540
541
542
543
544
545
546
547
548
549
550
551
552
@staticmethod
def vortex_diff(
    high: str | pl.Expr,
    low: str | pl.Expr,
    close: str | pl.Expr,
    window: int = 14,
    fillna: bool = False,
) -> pl.Expr:
    """Diff VI"""
    vip = ComplexTrendIndicators.vortex_pos(high, low, close, window, fillna)
    vin = ComplexTrendIndicators.vortex_neg(high, low, close, window, fillna)
    vid = vip - vin
    return BaseIndicator.check_fillna(vid, fillna, value=0)

adx_pos staticmethod

adx_pos(high: str | Expr, low: str | Expr, close: str | Expr, window: int = 14, fillna: bool = False) -> Expr

+DI

Source code in polars_ta/trend.py
587
588
589
590
591
592
593
594
595
596
597
598
599
600
601
602
603
604
605
606
@staticmethod
def adx_pos(
    high: str | pl.Expr,
    low: str | pl.Expr,
    close: str | pl.Expr,
    window: int = 14,
    fillna: bool = False,
) -> pl.Expr:
    """+DI"""
    high = as_expr(high)
    low = as_expr(low)
    close = as_expr(close)

    pos_dm, _, tr = ComplexTrendIndicators._adx_components(high, low, close, window)
    # A flat market has zero true range; report 0 directional strength there
    # rather than dividing by zero (which would leak inf/NaN).
    # Guard only tr == 0; a null tr is warm-up and must stay null (a
    # fill_null here would fabricate a 0 reading with no history).
    dip = pl.when(tr == 0).then(0.0).otherwise(100 * pos_dm / tr)
    return BaseIndicator.check_fillna(dip, fillna, value=20)

adx_neg staticmethod

adx_neg(high: str | Expr, low: str | Expr, close: str | Expr, window: int = 14, fillna: bool = False) -> Expr

-DI

Source code in polars_ta/trend.py
608
609
610
611
612
613
614
615
616
617
618
619
620
621
622
623
@staticmethod
def adx_neg(
    high: str | pl.Expr,
    low: str | pl.Expr,
    close: str | pl.Expr,
    window: int = 14,
    fillna: bool = False,
) -> pl.Expr:
    """-DI"""
    high = as_expr(high)
    low = as_expr(low)
    close = as_expr(close)

    _, neg_dm, tr = ComplexTrendIndicators._adx_components(high, low, close, window)
    din = pl.when(tr == 0).then(0.0).otherwise(100 * neg_dm / tr)
    return BaseIndicator.check_fillna(din, fillna, value=20)

adx staticmethod

adx(high: str | Expr, low: str | Expr, close: str | Expr, window: int = 14, fillna: bool = False) -> Expr

Average Directional Index (ADX)

Source code in polars_ta/trend.py
625
626
627
628
629
630
631
632
633
634
635
636
637
638
639
640
641
642
643
644
645
646
647
@staticmethod
def adx(
    high: str | pl.Expr,
    low: str | pl.Expr,
    close: str | pl.Expr,
    window: int = 14,
    fillna: bool = False,
) -> pl.Expr:
    """Average Directional Index (ADX)"""
    high = as_expr(high)
    low = as_expr(low)
    close = as_expr(close)

    dip = ComplexTrendIndicators.adx_pos(high, low, close, window, fillna)
    din = ComplexTrendIndicators.adx_neg(high, low, close, window, fillna)

    # When both +DI and -DI are zero (e.g. a flat market) DX is undefined;
    # treat it as zero directional movement instead of dividing by zero.
    di_sum = dip + din
    dx = pl.when(di_sum == 0).then(0.0).otherwise(100 * (dip - din).abs() / di_sum)
    # ADX is the smoothed moving average of DX
    adx_val = dx.ewm_mean(alpha=1.0 / window, adjust=False)
    return BaseIndicator.check_fillna(adx_val, fillna, value=20)

dx staticmethod

dx(high: str | Expr, low: str | Expr, close: str | Expr, window: int = 14, fillna: bool = False) -> Expr

Directional Movement Index (DX) — ADX before its final smoothing.

100 * |+DI - -DI| / (+DI + -DI). Noisier than ADX but reacts a full smoothing period sooner, which is why it is worth having separately.

Source code in polars_ta/trend.py
649
650
651
652
653
654
655
656
657
658
659
660
661
662
663
664
665
666
667
668
669
670
671
672
@staticmethod
def dx(
    high: str | pl.Expr,
    low: str | pl.Expr,
    close: str | pl.Expr,
    window: int = 14,
    fillna: bool = False,
) -> pl.Expr:
    """Directional Movement Index (DX) — ADX *before* its final smoothing.

    `100 * |+DI - -DI| / (+DI + -DI)`. Noisier than ADX but reacts a full
    smoothing period sooner, which is why it is worth having separately.
    """
    high = as_expr(high)
    low = as_expr(low)
    close = as_expr(close)

    dip = ComplexTrendIndicators.adx_pos(high, low, close, window, fillna)
    din = ComplexTrendIndicators.adx_neg(high, low, close, window, fillna)
    di_sum = dip + din
    dx_val = pl.when(di_sum == 0).then(0.0).otherwise(
        100 * (dip - din).abs() / di_sum
    )
    return BaseIndicator.check_fillna(dx_val, fillna, value=20)

adxr staticmethod

adxr(high: str | Expr, low: str | Expr, close: str | Expr, window: int = 14, fillna: bool = False) -> Expr

Average Directional Movement Index Rating (ADXR).

The mean of ADX now and ADX window bars ago. Smoother than ADX and traditionally used to judge whether trend strength itself is building or fading.

Source code in polars_ta/trend.py
674
675
676
677
678
679
680
681
682
683
684
685
686
687
688
689
690
691
692
693
694
@staticmethod
def adxr(
    high: str | pl.Expr,
    low: str | pl.Expr,
    close: str | pl.Expr,
    window: int = 14,
    fillna: bool = False,
) -> pl.Expr:
    """Average Directional Movement Index Rating (ADXR).

    The mean of ADX now and ADX `window` bars ago. Smoother than ADX and
    traditionally used to judge whether trend strength itself is building
    or fading.
    """
    high = as_expr(high)
    low = as_expr(low)
    close = as_expr(close)

    adx_val = ComplexTrendIndicators.adx(high, low, close, window, fillna)
    adxr_val = (adx_val + adx_val.shift(window)) / 2.0
    return BaseIndicator.check_fillna(adxr_val, fillna, value=20)

plus_dm staticmethod

plus_dm(high: str | Expr, low: str | Expr, close: str | Expr, window: int = 14, fillna: bool = False) -> Expr

Plus Directional Movement (+DM), Wilder-smoothed.

The raw upward component behind +DI, before it is normalized by true range. Useful as a model feature on its own, since it keeps the magnitude of directional movement that +DI divides away.

Source code in polars_ta/trend.py
696
697
698
699
700
701
702
703
704
705
706
707
708
709
710
711
712
713
714
715
@staticmethod
def plus_dm(
    high: str | pl.Expr,
    low: str | pl.Expr,
    close: str | pl.Expr,
    window: int = 14,
    fillna: bool = False,
) -> pl.Expr:
    """Plus Directional Movement (+DM), Wilder-smoothed.

    The raw upward component behind +DI, before it is normalized by true
    range. Useful as a model feature on its own, since it keeps the
    magnitude of directional movement that +DI divides away.
    """
    high = as_expr(high)
    low = as_expr(low)
    close = as_expr(close)

    pos_dm, _, _ = ComplexTrendIndicators._adx_components(high, low, close, window)
    return BaseIndicator.check_fillna(pos_dm, fillna, value=0)

minus_dm staticmethod

minus_dm(high: str | Expr, low: str | Expr, close: str | Expr, window: int = 14, fillna: bool = False) -> Expr

Minus Directional Movement (-DM), Wilder-smoothed.

The downward counterpart of plus_dm.

Source code in polars_ta/trend.py
717
718
719
720
721
722
723
724
725
726
727
728
729
730
731
732
733
734
@staticmethod
def minus_dm(
    high: str | pl.Expr,
    low: str | pl.Expr,
    close: str | pl.Expr,
    window: int = 14,
    fillna: bool = False,
) -> pl.Expr:
    """Minus Directional Movement (-DM), Wilder-smoothed.

    The downward counterpart of `plus_dm`.
    """
    high = as_expr(high)
    low = as_expr(low)
    close = as_expr(close)

    _, neg_dm, _ = ComplexTrendIndicators._adx_components(high, low, close, window)
    return BaseIndicator.check_fillna(neg_dm, fillna, value=0)

psar staticmethod

psar(high: str | Expr, low: str | Expr, close: str | Expr, step: float = 0.02, max_step: float = 0.2, fillna: bool = False) -> Expr

Parabolic SAR computed using map_batches for stateful execution.

Source code in polars_ta/trend.py
739
740
741
742
743
744
745
746
747
748
749
750
751
752
753
754
755
756
757
758
759
760
761
762
763
764
765
766
767
768
769
770
771
772
773
774
775
776
777
778
779
780
781
782
783
784
785
786
787
788
789
790
791
792
793
794
795
796
797
798
799
800
801
802
803
804
805
806
807
808
809
810
811
812
813
814
815
816
@staticmethod
def psar(
    high: str | pl.Expr,
    low: str | pl.Expr,
    close: str | pl.Expr,
    step: float = 0.02,
    max_step: float = 0.20,
    fillna: bool = False,
) -> pl.Expr:
    """Parabolic SAR computed using map_batches for stateful execution."""
    high = as_expr(high)
    low = as_expr(low)
    close = as_expr(close)

    def _calc_psar(struct_s: pl.Series) -> pl.Series:
        """Internal NumPy loop to handle the FSM logic of PSAR."""
        df = struct_s.struct.unnest()
        h_arr = df["high"].to_numpy()
        l_arr = df["low"].to_numpy()
        c_arr = df["close"].to_numpy()

        n = len(c_arr)
        if n < 2:
            return pl.Series(c_arr)

        psar = np.copy(c_arr)
        up_trend = True
        af = step
        up_trend_high = h_arr[0]
        down_trend_low = l_arr[0]

        for i in range(2, n):
            reversal = False
            max_high = h_arr[i]
            min_low = l_arr[i]

            if up_trend:
                psar[i] = psar[i - 1] + (af * (up_trend_high - psar[i - 1]))
                if min_low < psar[i]:
                    reversal = True
                    psar[i] = up_trend_high
                    down_trend_low = min_low
                    af = step
                else:
                    if max_high > up_trend_high:
                        up_trend_high = max_high
                        af = min(af + step, max_step)
                    low1, low2 = l_arr[i - 1], l_arr[i - 2]
                    if low2 < psar[i]:
                        psar[i] = low2
                    elif low1 < psar[i]:
                        psar[i] = low1
            else:
                psar[i] = psar[i - 1] - (af * (psar[i - 1] - down_trend_low))
                if max_high > psar[i]:
                    reversal = True
                    psar[i] = down_trend_low
                    up_trend_high = max_high
                    af = step
                else:
                    if min_low < down_trend_low:
                        down_trend_low = min_low
                        af = min(af + step, max_step)
                    high1, high2 = h_arr[i - 1], h_arr[i - 2]
                    if high2 > psar[i]:
                        psar[i] = high2
                    elif high1 > psar[i]:
                        psar[i] = high1

            up_trend = up_trend != reversal

        return pl.Series(psar)

    # Pack columns into a struct and pass to map_batches
    expr = pl.struct(
        [high.alias("high"), low.alias("low"), close.alias("close")]
    ).map_batches(_calc_psar, returns_scalar=False)
    return BaseIndicator.check_fillna(expr, fillna, value=-1)

stc staticmethod

stc(close: str | Expr, window_slow: int = 50, window_fast: int = 23, cycle: int = 10, smooth1: int = 3, smooth2: int = 3, fillna: bool = False) -> Expr

Schaff Trend Cycle (STC)

Source code in polars_ta/trend.py
821
822
823
824
825
826
827
828
829
830
831
832
833
834
835
836
837
838
839
840
841
842
843
844
845
846
847
848
849
850
851
852
853
854
855
856
857
858
859
860
861
862
863
864
865
866
867
@staticmethod
def stc(
    close: str | pl.Expr,
    window_slow: int = 50,
    window_fast: int = 23,
    cycle: int = 10,
    smooth1: int = 3,
    smooth2: int = 3,
    fillna: bool = False,
) -> pl.Expr:
    """Schaff Trend Cycle (STC)"""
    close = as_expr(close)
    min_periods_cycle = 1 if fillna else cycle

    # 1. MACD Line
    ema_fast = BaseIndicator.ema(close, window_fast, fillna)
    ema_slow = BaseIndicator.ema(close, window_slow, fillna)
    macd = ema_fast - ema_slow

    # 2. Stochastic of MACD
    macd_min = macd.rolling_min(window_size=cycle, min_samples=min_periods_cycle)
    macd_max = macd.rolling_max(window_size=cycle, min_samples=min_periods_cycle)

    # Guard against division by zero in stochastic calculation
    macd_range = macd_max - macd_min
    macd_range = pl.when(macd_range == 0).then(1).otherwise(macd_range)
    stoch_k = 100 * (macd - macd_min) / macd_range

    # 3. Smoothed Stochastic
    stoch_d = BaseIndicator.ema(stoch_k, smooth1, fillna)

    # 4. Stochastic of Smoothed Stochastic
    stoch_d_min = stoch_d.rolling_min(
        window_size=cycle, min_samples=min_periods_cycle
    )
    stoch_d_max = stoch_d.rolling_max(
        window_size=cycle, min_samples=min_periods_cycle
    )

    stoch_d_range = stoch_d_max - stoch_d_min
    stoch_d_range = pl.when(stoch_d_range == 0).then(1).otherwise(stoch_d_range)
    stoch_kd = 100 * (stoch_d - stoch_d_min) / stoch_d_range

    # 5. Final STC (Smoothed again)
    stc_val = BaseIndicator.ema(stoch_kd, smooth2, fillna)

    return BaseIndicator.check_fillna(stc_val, fillna, value=0)

hull_moving_average staticmethod

hull_moving_average(close: str | Expr, window: int = 9, fillna: bool = False) -> Expr

Hull Moving Average: WMA(2*WMA(n/2) - WMA(n), sqrt(n)).

Reduces the lag inherent in a plain moving average while staying smoother than price itself, at the cost of the extra WMA passes needing window + round(sqrt(window)) - 1 bars of warm-up.

Source code in polars_ta/trend.py
872
873
874
875
876
877
878
879
880
881
882
883
884
885
886
887
888
889
890
891
@staticmethod
def hull_moving_average(
    close: str | pl.Expr, window: int = 9, fillna: bool = False
) -> pl.Expr:
    """Hull Moving Average: WMA(2*WMA(n/2) - WMA(n), sqrt(n)).

    Reduces the lag inherent in a plain moving average while staying
    smoother than price itself, at the cost of the extra WMA passes
    needing `window + round(sqrt(window)) - 1` bars of warm-up.
    """
    close = as_expr(close)
    half_window = max(1, round(window / 2))
    sqrt_window = max(1, round(np.sqrt(window)))

    wma_half = TrendIndicators.wma_indicator(close, half_window, fillna)
    wma_full = TrendIndicators.wma_indicator(close, window, fillna)
    raw_hma = 2 * wma_half - wma_full

    hma = TrendIndicators.wma_indicator(raw_hma, sqrt_window, fillna)
    return BaseIndicator.check_fillna(hma, fillna, value=0)

supertrend staticmethod

supertrend(high: str | Expr, low: str | Expr, close: str | Expr, window: int = 10, multiplier: float = 3.0, fillna: bool = False) -> Expr

SuperTrend line: an ATR-banded trend-following stop-and-reverse indicator, computed via map_batches for the stateful band-flip logic (the same style as psar).

Source code in polars_ta/trend.py
896
897
898
899
900
901
902
903
904
905
906
907
908
909
910
911
912
913
914
915
916
917
918
919
920
921
922
923
924
925
926
927
928
929
930
931
932
933
934
935
936
937
938
939
940
941
942
943
944
945
946
947
948
949
950
951
952
953
954
@staticmethod
def supertrend(
    high: str | pl.Expr,
    low: str | pl.Expr,
    close: str | pl.Expr,
    window: int = 10,
    multiplier: float = 3.0,
    fillna: bool = False,
) -> pl.Expr:
    """SuperTrend line: an ATR-banded trend-following stop-and-reverse
    indicator, computed via `map_batches` for the stateful band-flip
    logic (the same style as `psar`)."""
    high = as_expr(high)
    low = as_expr(low)
    close = as_expr(close)

    atr = VolatilityIndicators.average_true_range(high, low, close, window)
    hl2 = (high + low) / 2.0
    basic_upper = hl2 + multiplier * atr
    basic_lower = hl2 - multiplier * atr

    def _calc_supertrend(struct_s: pl.Series) -> pl.Series:
        df = struct_s.struct.unnest()
        c_arr = df["close"].to_numpy()
        bu_arr = df["bu"].to_numpy()
        bl_arr = df["bl"].to_numpy()
        n = len(c_arr)

        supertrend = np.full(n, np.nan)
        start = int(np.argmax(~np.isnan(bu_arr))) if np.isnan(bu_arr).any() else 0
        if np.isnan(bu_arr).all() or n == 0:
            return pl.Series(supertrend).fill_nan(None)

        final_upper = bu_arr[start]
        final_lower = bl_arr[start]
        up_trend = True
        supertrend[start] = final_lower

        for i in range(start + 1, n):
            if bu_arr[i] < final_upper or c_arr[i - 1] > final_upper:
                final_upper = bu_arr[i]
            if bl_arr[i] > final_lower or c_arr[i - 1] < final_lower:
                final_lower = bl_arr[i]

            if up_trend:
                if c_arr[i] < final_lower:
                    up_trend = False
            else:
                if c_arr[i] > final_upper:
                    up_trend = True

            supertrend[i] = final_lower if up_trend else final_upper

        return pl.Series(supertrend).fill_nan(None)

    expr = pl.struct(
        [close.alias("close"), basic_upper.alias("bu"), basic_lower.alias("bl")]
    ).map_batches(_calc_supertrend, returns_scalar=False)
    return BaseIndicator.check_fillna(expr, fillna, value=0)

elder_bull_power staticmethod

elder_bull_power(high: str | Expr, low: str | Expr, close: str | Expr, window: int = 13, fillna: bool = False) -> Expr

Bull Power: high minus a 13-bar EMA of close.

Source code in polars_ta/trend.py
959
960
961
962
963
964
965
966
967
968
969
970
971
972
@staticmethod
def elder_bull_power(
    high: str | pl.Expr,
    low: str | pl.Expr,
    close: str | pl.Expr,
    window: int = 13,
    fillna: bool = False,
) -> pl.Expr:
    """Bull Power: high minus a 13-bar EMA of close."""
    high = as_expr(high)
    close = as_expr(close)
    ema = BaseIndicator.ema(close, window, fillna)
    bull = high - ema
    return BaseIndicator.check_fillna(bull, fillna, value=0)

elder_bear_power staticmethod

elder_bear_power(high: str | Expr, low: str | Expr, close: str | Expr, window: int = 13, fillna: bool = False) -> Expr

Bear Power: low minus a 13-bar EMA of close.

Source code in polars_ta/trend.py
974
975
976
977
978
979
980
981
982
983
984
985
986
987
@staticmethod
def elder_bear_power(
    high: str | pl.Expr,
    low: str | pl.Expr,
    close: str | pl.Expr,
    window: int = 13,
    fillna: bool = False,
) -> pl.Expr:
    """Bear Power: low minus a 13-bar EMA of close."""
    low = as_expr(low)
    close = as_expr(close)
    ema = BaseIndicator.ema(close, window, fillna)
    bear = low - ema
    return BaseIndicator.check_fillna(bear, fillna, value=0)